Result presentations are the same as for load profiles in all essential parts except what is described here. Other: see section Results below.
After a complete calculation with hourly values, a graph is automatically obtained that describes effects at the feeding point for the calculation. The curve Measured kW can only be obtained if measured values are loaded in the feeding point. For the moment it is only possible to store measured values via the transformers.
Graphical results after calculations with historical measurements
After a calculation has been performed an excel report is retrieved of the power distribution for the feeding points over the last 24 hours. You will also retrieve a graph for the active power with and without losses.
When we have saved currents and voltage for all the hour, it is possible to present graphs for this.
Select a line object and right-click in order to retrieve the menu alternatives:
Calculated values > Hour values > Result graphic.
If you do the same operation on a node, you will retrieve a voltage graph over the last 24 hours
Voltage graph
Total calculation when calculating with historical measurements
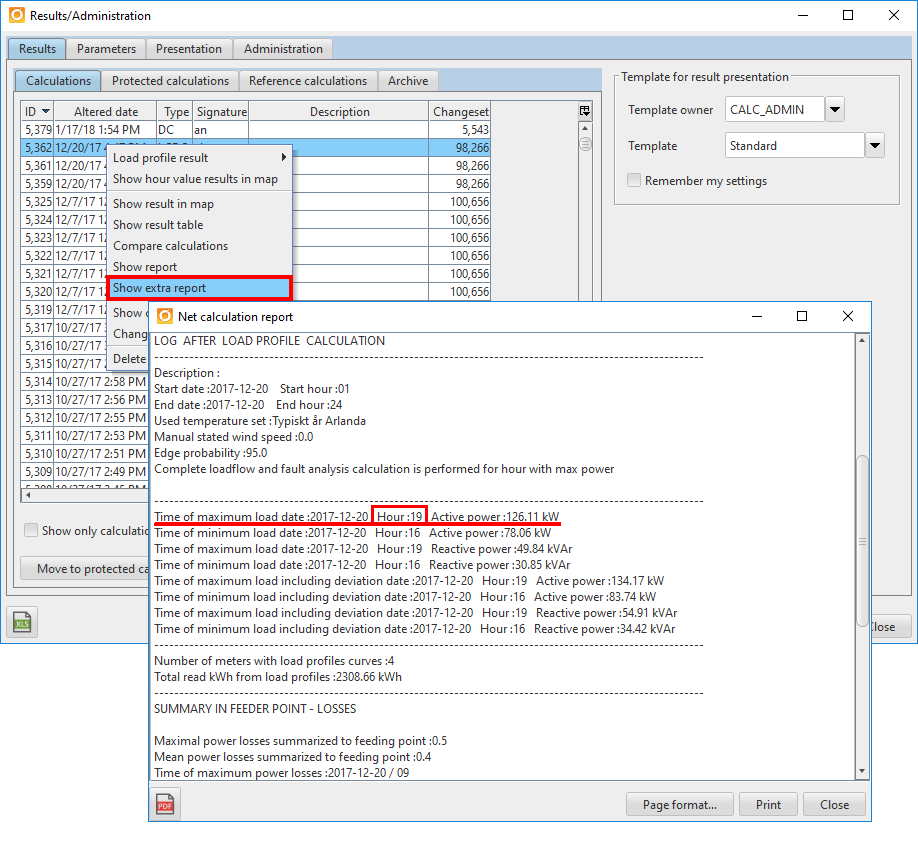
We select to calculate a normal calculation for the highest power of the hour in the start form.
In the extra report we can retrieve a compilation of the hour calculations. Here it is possible to display that the highest power for the hour is at 19.00 with 126,11 kW
Except for all the normal results there are one special report that regards hour calculation. The report is called Combined report LP.
In the report it is possible to display the highest load and which time for each conductor. It is also possible to display the lowest power and time for each node.
Result presentations are the same as for load profiles in all the essential parts except for what is described here. See section Results.
After a calculation with historical measurements has been performed, you will automatically retrieve a graph that describes power in the feeding points for the calculation. The curve Measured kW can only be retrieved if the measured values are loaded in the feeding point. Today it is only possible to store measured values through the transformers.
Graph for results in a feeding point:
Excel presentation for the results in a feeding point:
Except for the graph described above, you will retrieve an excel report with the same information as the graph.
Calculated kW is the summarized power for underlying meters with added network losses.
Measured kW is the power that is retrieved from the loaded values in the transformer.
Summarized kW is the summarized power from the meters.
Show used hour values in a delivery point
If you have saved the values that has been used when calculating, it is possible to display them by using the right-click function in the same way as for the load profiles:
Calculated values > Hour values > Input to calculation graphic.
Chart of summarized differences
In order to describe the content of of the chart, a faulty station is used to simplify the result. Only one station is displayed in the example.
Chart that is retrieved after a summarized calculation with only one substation.
In order to describe the content in an even more simple way the chart that is retrieved during a normal calculation with historical measurements is used for the same station.
Chart of measured differences
A summarize of the time interval that has been retrieved from all the differences, both positive and negative difference between the meter in the station and all the underlying meters. (The absolut amount of differences).
In the example below approximately 60kWh in differences are retrieved during the period.
Chart of summarized positive differences
Summarized differences are retrieved here, where a station measurement is grater than the summarized curve. (This is the most normal).
Chart of summarized negative differences
Summarized differences are retrieved here, where a station measurement is less than the summarized curve. This indicates that there are faulty data or faulty network structure.
Summarized power for the interval and network that is included in the presentation.
Display statistics for losses based on historical measurements
This function can only be performed if measurement values are registered for both delivery points and substations. Trace a network containing the wanted substations including their underlying low voltage network. Select the alternative Show statistics for losses based on historical hour values and select the time interval that the statistics should be displayed for. Start the calculation.
In the result list in the window Result/Administration, the performed calculation is displayed with the type HLS. Right-click on the calculation and select Loss statistics.
A new window is opened which displays a table with losses and other KPI's. To retrieve a clear overview of the results, it is possible to press the button View chart.
Several charts are displayed which visualizes the result from the calculation in a clear way.