Show stored historical measurements
Historical measurement data can be connected to individual customer meters and transformers.
The loading of the measurement data are described in another section.
In order to see if there are any measurement data it is possible to use the right-click function on a transformer id, delivery point or the substation station.
1.Search for a transformer, delivery point or a substation.
2.Right-click and select Measured values > Historical measurements.
3.Use the Historical measurements dialog to limit your search and press OK when you are satisfied with the entered data.
4.Enter relevant information or press OK directly. A time series diagram opens by default in a new window where information about measured values can be read out. By pressing the button at the top right of the new window, you can switch between duration charts or time series charts. If there are any stored measurement values they will be displayed in a graphical window.
Show measurements for a transformer
Show all read and summed historical hourly values for an individual station.
To examine shorter time periods, you can use the functions found via the icon with a magnifying glass.
Time series charts can be converted to duration charts by pressing the chart icon in the chart window ![]() .
.
Show measurement for a delivery point
1.Right-click on a delivery point, select Measured values > Historical measurements.
2.Use the dialog to limit your search and press OK when you are satisfied with the entered data.
3.If a delivery point has several meters/customers, select the alternative Options for displaying multiple curves and press the preferred radio button for the graph.
oIt is possible to zoom in the graph that has been generated by using the scroll wheel or press the button Zoom in/out.
oIn order to move the graph laterally, use shift and drag the graph sideways.
4.In order to show all the loaded summarized historical hour values for a substation right-click and select Calculated values > Hour values > Load profiles, summation.
Calculate with historical measurements
The calculation starts as a normal distribution calculation.
After a trace has been performed:
1.Select the tab Load values and press the radio button Historical measurement in order for the tab Historical measurements to be activated.
2.Select the tab Historical measurements and set the conditions that you need in order to perform a network calculation with historical hour values.
3.Enter the Start date and the End date.
|
You need to be aware of which time intervals there are stored hour values for. |
Define time interval for the calculation
Use the calender and the drop down lists to set start and end time for the calculations. The calculation can only be performed for the hours that are entered in the historical database. Make sure to check the start time and the end time hence a mistake can generate a very large result if you have selected to save the result for every hour. E.g. a monthly calculation can generate approximately 700 load calculations, if you have choose to save data for individual nodes and conductors, it will be very large volume very fast. There are no problems with performing time series over a long time but it should be done with an extra thought.
With the button Find peak you can get the time with the highest consumption. This can be done either with or without a time limit. Note that measurement data for the entire tracked network is analyzed, which can mean that the function can take a long time to run if large amounts of data are to be handled.
Normal calculation for historical hour values
A normal load calculation will be performed according to the parameters in section A, C, D and E.
Perform a load calculation using highest or lowest hour identified in the feeding point
If you wish you can ask for a complete load calculation for either highest hour or lowest hour automatically during the prognosis of a time series. After the prognosis calculation over all of the requested hours the highest and the lowest hours will be identified in the feeding point. The highest and the lowest hour can then be used in order to perform a complete distribution calculation for this hour. Both the fault analysis calculation and the load calculation are performed as usual.
Save hour value that has been used as input data for load calculation
All the hour values that has been retrieved for the calculation are saved in the database, it can be retrieved and displayed as a chart.
|
It is only the latest calculation values that are saved. |
Save and view full calculation results
Save calculation results for every hour in the selected time period:
1.In the Network calculation dialog, select the Load tab.
2.In the More fields section, check the Save results for all hours box.
When this option is selected, the system saves results for each object and for every hour within the time range specified in the date selection fields.
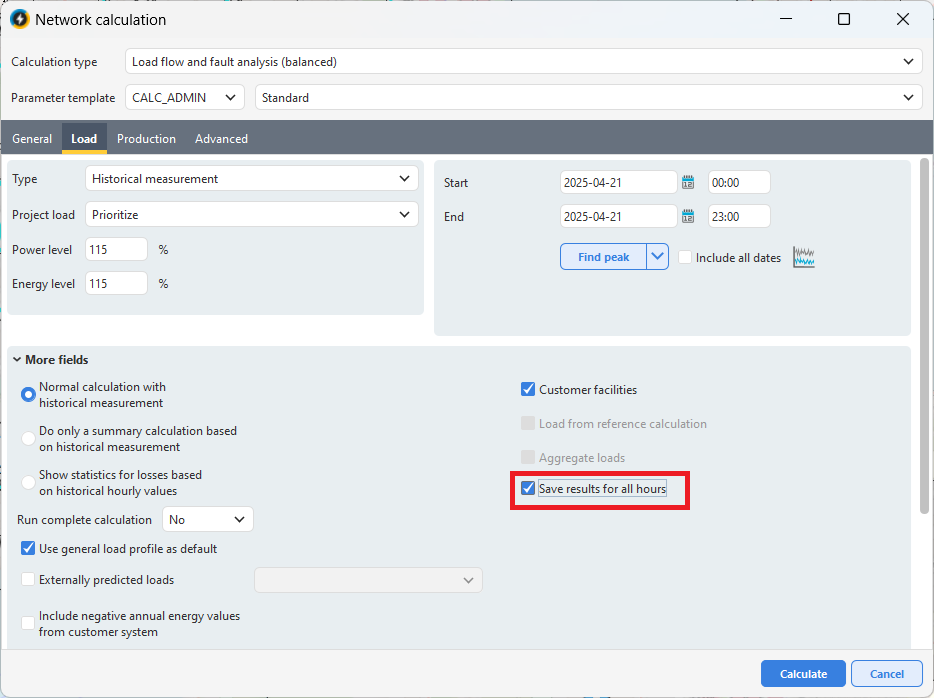
Check box Save results for all hours
|
Enabling this option significantly increases database storage usage and should be used with caution. |
Only one full-hour result set is stored at a time. If a new calculation is run with Save results for all hours enabled, it will overwrite the previous one to minimize database impact.
To view the complete set of saved results:
1.In the Results/Administration dialog, right-click the relevant calculation and select Show result in map > Complete calculation.