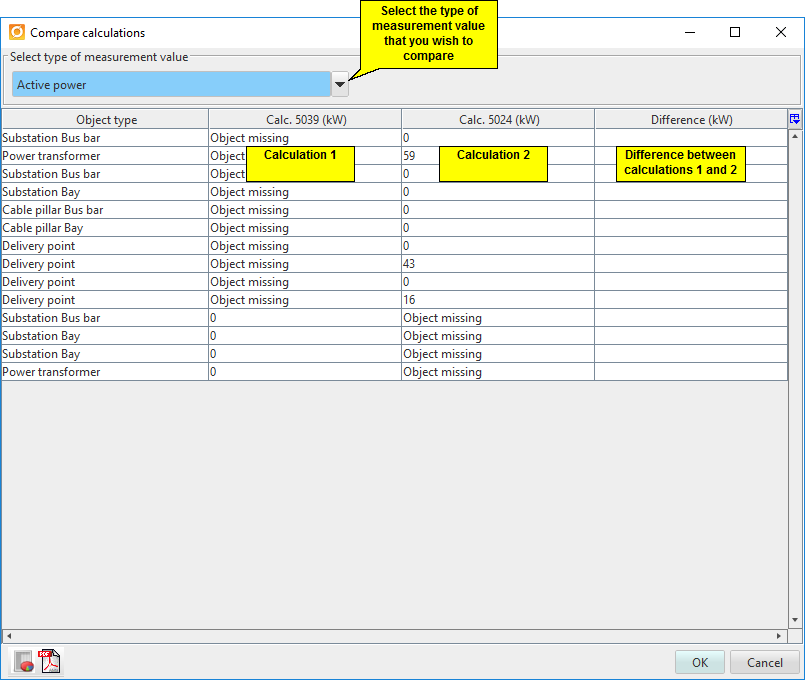
In the calculation tab Results/Administration there is a possibility to compare calculations with each other. This can be done if e.g a delivery point has an increased energy consumption and you need to verify how the network is affected by this. By selecting two calculations, right-click and select compare calculations, you will receive a table that displays the differences for each object between the two calculations.
The result types are viewed separately.
The table can be sorted by column and each object can be displayed in the map by using the right-click menu.
The rows in the column Difference have different colors depending on the results. A positive difference has a green color, a negative difference has a red color and if there are no difference between the calculations it is represented by a white color.