Right-click on a row and select Show result in map. The calculation result will be viewed as a thematic map. Make sure that a template has been chosen at Template for result presentation before a function is selected. Select if you want to customize the views to show the calculation result.
The result will be presented as:
•The thematic map that colors the objects and writes text in the map under the presentation template.
•Tooltip - Show results for an object by moving the mouse over the object in the map.
•As tables with results.
When coloring the network according to the presentation template, you can select which color tables to display by enabling / disabling them using the Active check box. Networks not included in the calculation are grayed out.
Settings can be changed by pressing the button ![]() .
.
The dialog Settings is opened where you have the possibility to set text size for the scheme and map. The button update positions updates the texts.
Show result for one object by pressing the button ![]() .
.
Select an object that have been included in the calculation. The form that opens will display the calculation result for the object.
|
Show result table by pressing the button ![]() .
.
In the table that is shown, you can right-click on a row and e.g. display the object in the map or show/change in the attribute form. In the table you can change the position of the columns by dragging them to the right/left. The table can also be sorted by a column by selecting the columns heading. In this way, you can easily find results with critical values, such as the lowest pressure, highest temperature, etc.
Show result table for selected components by pressing the button ![]() .
.
Select the components that you want to include in the result table and press the button. The result is presented in the same way as Show result table.
|
1.Select object(-s) in in the view. 2.Press the button and you will get a report for the selected objects.
|
Sort the result
Select a column header once. Sorting will be done in the sort order the arrow shows. Hold down the key CTRL if you want to sort on several columns.
Color cells
A function to color the same result terms in the table that is used for the thematic coloring in the map and schema. It is also possible to filter on the different levels that has been stated in the result presentation template for graphical result presentation.
Move calculation texts in the map by pressing the button ![]() .
.
Moves the calculation results that has been placed in the map. Press the button and then the result that should be moved.
|
Press the button Move text.
|
Move the text |
|
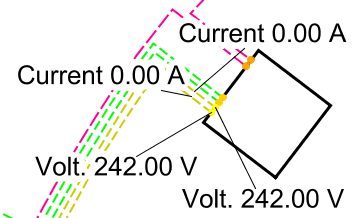
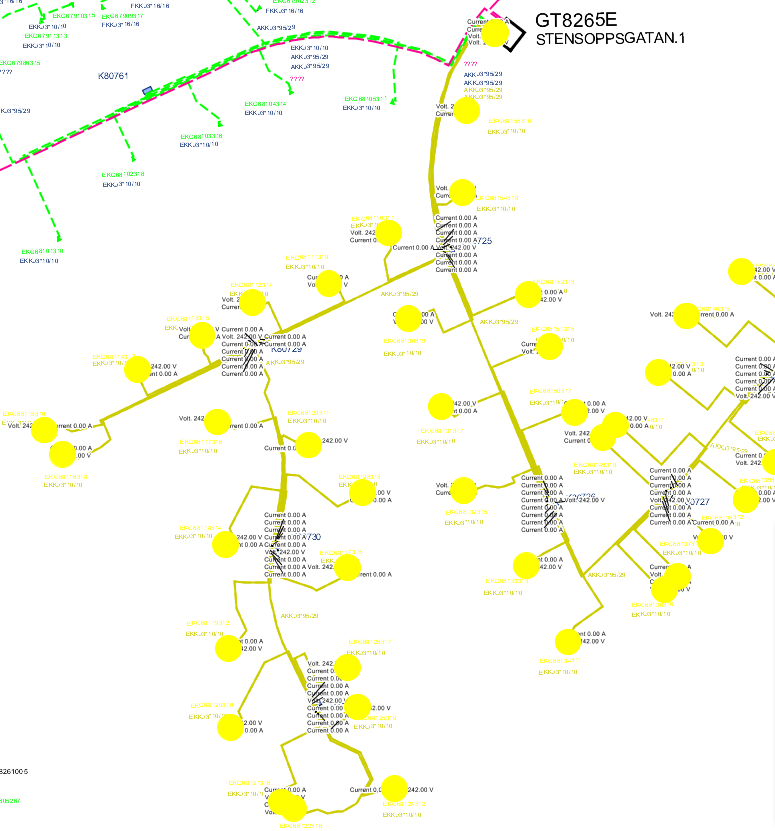
Enhanced thematic presentation
Show enhanced thematic presentation by pressing the show/hide extended graphics button ![]() .
.
This option will generate circles around point-objects, with a radius that increases with the increasing number of colors, and with thicker lines for sections, increasing for the number of colors.
Enhanced thematic presentation in the map:
To reset the enhanced thematic presentation to a normal presentation press the button ![]() .
.
Show current direction in map by pressing the button ![]() .
.
The current direction is shown in the map with an arrow symbol. If the current is zero, circles are shown in the map instead.
Presentation of the result as tooltip
When moving the mouse cursor over an object with calculation results, the result values will appear as a tooltip window.
Enlarge result texts in the map and schema
The Update Positions button will calculate new placements of the text.
View result table
The same table that can be presented from the menu selection Show results in map can be obtained here directly without starting the graphic presentation.