Introduction
Short-term forecast is an add-on module to dpPower Analyzer that is used to predict the load in the electricity network one to two days ahead. The purpose is to provide better insight into the future state of the grid and enable actions before, for example, overload occurs. The module is designed to run fully automated.
|
Requires the modules: •Load Profiles •Live measurements with SCADA integration |
For information on load profiles, see section Load profiles.
For information about the SCADA integration, see section Manage Measurement points in the network.
How forecasting and calculations work
The forecasting process is based on predictive load flow calculations combined with load calibration. Individual load profiles are used as input data, and are used to calculate the current in the outgoing feeder of the primary substation. This calculated current is continuously compared with the corresponding SCADA measurements, and the load profiles are iteratively scaled until the deviation between calculated and measured feeder currents is withing acceptable limits.
The network state estimation relies on statistical load model (profiles), measured and forecasted electrical currents and temperature data. To obtain the future measurement values required in this process, mathematical time-series models such as ARIMA, AutoSARIMA, and SARIMA are applied. Temperature forecasts are retrieved automatically from SMHI, ensuring that both short-term trends and weather-driven load variations are accurately represented in the final load forecast.
This process is repeated every hour for the forecast interval.

The current forecast is calculated using mathematical models such as ARIMA or SARIMA, and temperature forecasts are automatically retrieved from SMHI.
The calculations are performed per primary substation and can include or exclude the low-voltage network. A primary substation can be added using the plus button in the real-time panel, select Analyzer > Analyzer real-time > Real-time dashboard.
Displaying the results
The results are displayed in the real-time panel in the sidebar, select Analyzer > Analyzer real-time > Real-time dashboard.
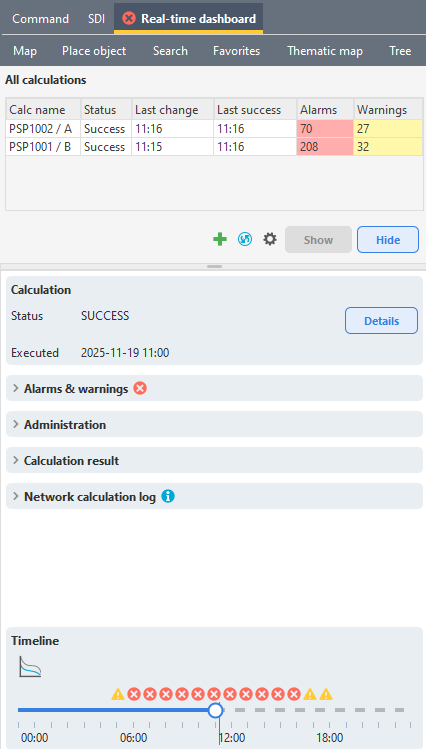
The system mainly presents alarms and warnings, for example when the calculated current is expected to exceed allowed levels.
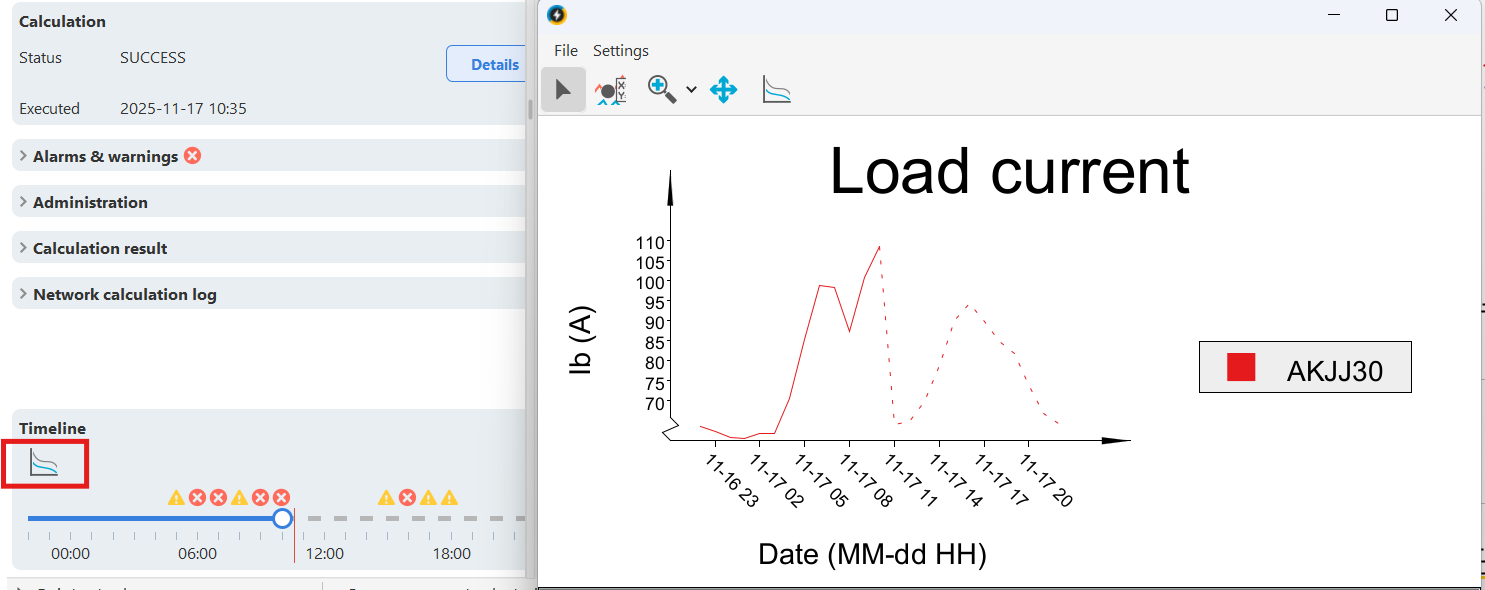
Timeline appearance:
•Historical values are shown with a solid line.
•Current time is marked with a red vertical line.
•The forecast ahead is shown with a dashed line.
•Alarms are marked with red circle with cross.
•Warnings are marked with yellow triangle with exclamation mark.
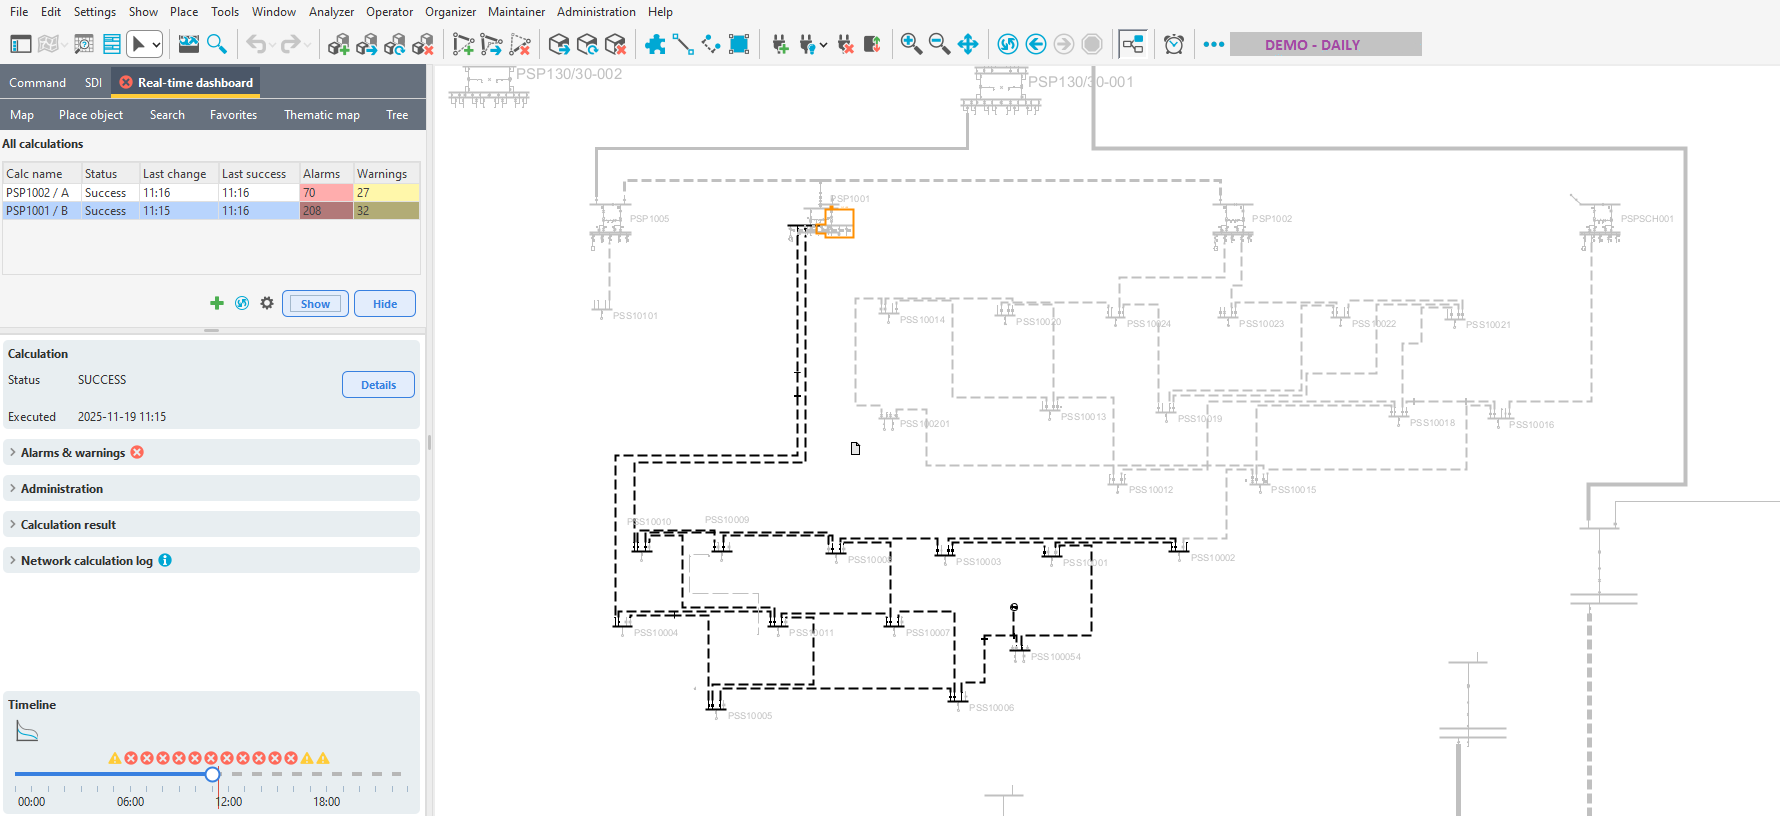
Map and schematic view
Press Show to color the grid based on current alerts and alarms by default. This provides a visual overview of areas that may require action.
Coloring by Alarms and Warnings
This function provides a visual overview of areas in the network that may require attention. In the map view, the color of each object shows its alarm or warning status at the selected hour on the timeline.
Typical colors used:
•Green - Normal operation (no active alarms or warnings)
•Yellow - Active alert or non-critical issue
•Red - Active alarm or critical issue
•Gray - No data or not in operation
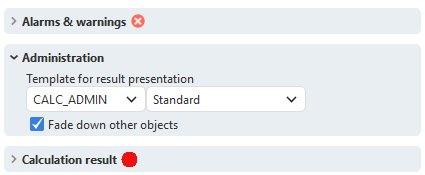
Coloring by presentation template
Press Details to color the network based on the presentation template selected in the Administration tab.
Display an individual result for an object
The forecast calculation stores a limited set of key results, including absolute and relative current, voltage, voltage drop, and relative transformer loading. For each relevant object, a complete time-series result is available.
To view these results:
1.Select the object.
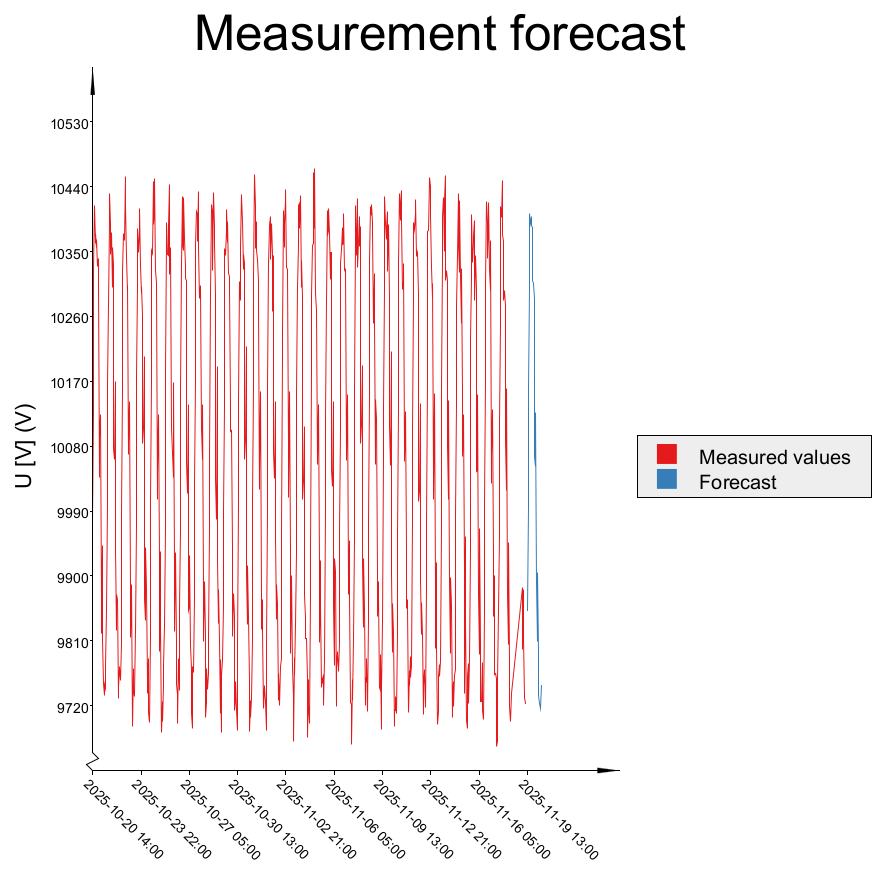
2.Press the ![]() icon under Timeline. In the chart, solid lines represent historical and current calculated values, while dashed lines represent the forecasted values.
icon under Timeline. In the chart, solid lines represent historical and current calculated values, while dashed lines represent the forecasted values.
Verify the accuracy of the forecast
To facilitate the verification process, two reports are available in the query tool
•Measurement Values - Provides an overview of the measured SCADA data and can be used to detect anomalies.
•Measurement Value Forecasts - Shows several metrics illustrating the deviations between forecasted and measured values.