About Real-time
The Real-time module is an expansion to Operator. Real-time is intended for those who handles operation outages and other switchings as they occur/are planned, as opposed to those who registers outages retrospectively for outage statistics.
Real-time makes it possible to separate feeding bays, visualize loop feeds and networks connected to earth, and get notifications in case of unplanned events such as fault reports or SCADA alarms. The alternative feeding path function provides optimized switching suggestions based on load and voltage drop.
|
For the Real time module to be active and customized, a customer-specific configuration is required. Contact Digpro for assistance with this. The ability to handle additional SCADA events depends on the current SCADA system and the physical equipment in the network. |
Key features
•Simulation - Visualize the consequences of switch orders and operating orders in the map and schedule, even back in time.
•Colored topology tracing - Separate the parts of the network based on outgoing bays, loop feed, earthing networks and conflicts between energized and earthing networks.
•Dynamic symbols - Display outages and fault reports as icons with additional information on status, number of customers affected and type of call.
•Extended list of alarms - Alerts the operator to incoming fault reports and outages with additional information such as important operational information or personal danger and navigation to the incident in question.
•Extended support for blockages - Blocked devices are displayed with a symbol in the graphical view and any attempts to operate blocked devices are met with a warning dialog.
•Area surveillance - sharing the network between operators in case of major disturbances.
•Maneuver control - Warn of undesirable consequences such as de-energized customers, parallel feeding, blocked devices and connections between a powered network against earth before performing the operation.
•Fault indicators and tripping currents - Use SCADA alarms to locate faults in the network.
•Alternative feeding paths - Get optimized switching suggestions based on load, voltage drop and appliance type.
•Fault reporting - Possibility to configure a separate application for fault reporting.
Dynamic coloring
|
To give a user access to dynamic coloring without other Operator rights, the administrator can assign only the OPERATOR_DYNAMIC_COLOR role. With this role, the user can activate the function from the toolbar and adjust settings under Operator > Operator preferences but does not have access to other operator functions. |
Dynamic coloring provides a visual overview of the current status of the network, making it easy to identify areas that are energized, multi-fed, or de-energized directly in the map or schematic. In the event of a fault or outage in the network, dynamic coloring can be used to quickly identify which parts of the network have lost power (displayed in gray) and which parts remain energized.
The coloring is controlled by the topology analyzer, which determines which objects are fed and whether they are multi-fed.
The dynamic coloring is activated via Operator > Operator preferences > My preferences > Dynamic coloring. The function can also be started from the toolbar with the button ![]() . The dynamic coloring works even without Operator being active. If the function is turned on, the de-energized network is displayed in grey. If dynamic coloring is not updated correctly after restarting the topology analyzer or after stopping and starting Operator, the coloring may need to be reset manually. This is done by turning the function off and on again.
. The dynamic coloring works even without Operator being active. If the function is turned on, the de-energized network is displayed in grey. If dynamic coloring is not updated correctly after restarting the topology analyzer or after stopping and starting Operator, the coloring may need to be reset manually. This is done by turning the function off and on again.
The default behavior is as follows:
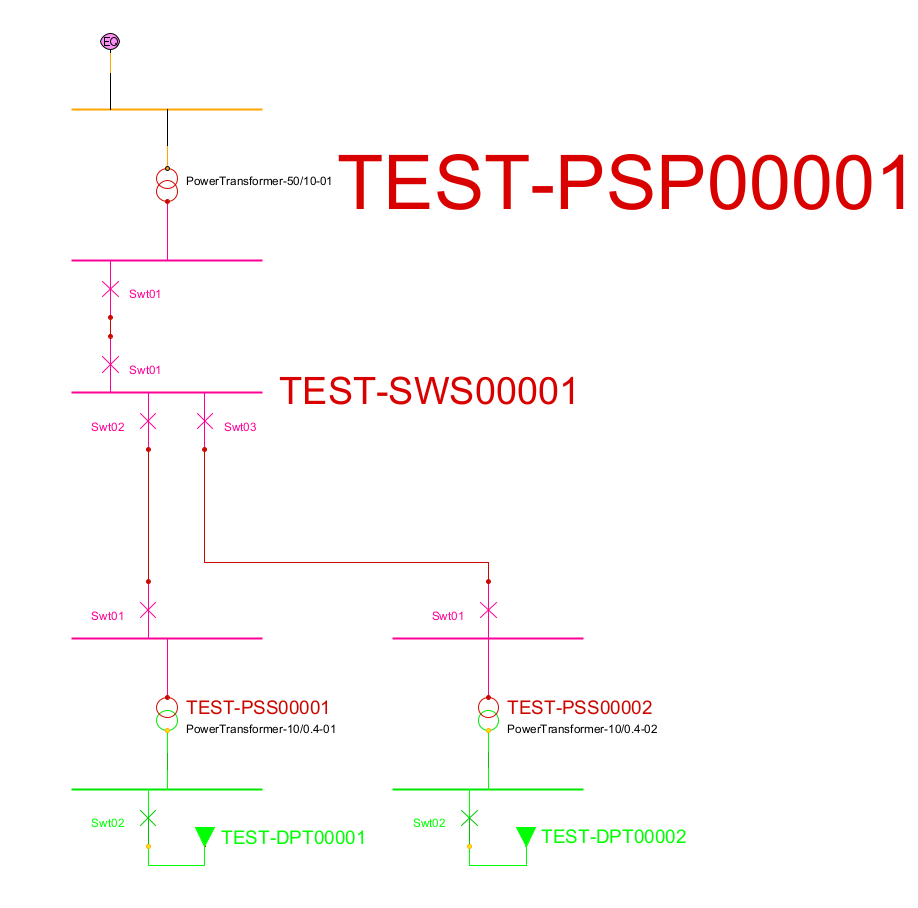
•Basic coloring - Objects are color-coded based on voltage levels. The standard configuration uses voltage levels of 6 kV, 10 kV and 20 kV.
•Multi-feed objects - If an object can be traced to more than one active feeding bay, it will be marked as multi-fed and displayed in bold yellow color in the default configuration.
The topology analyzer considers an object to be energized if it can be traced to an active bay. For a bay to be considered active, the following applies:
•The bay must be of type Substation bay, otype=707000. Other bay types are ignored.
•There must be a traceable path from the bay to a feeding busbar without open switching devices in between.
•The bay must have a voltage level (subtype) that is in the configured accepted subtypes list.
•The bay must have a lower voltage level than the station it belongs to.
|
Example: A 10 kV bay in a 20 kV station is active, but a 20 kV bay in the same station is not. Exception - If the bay belongs to a substation switchstation, otyp=702006, it can have the same voltage level as the station. |
|
Feeding bay attribute: •Force feeding makes the bay active by default. •Force non-feeding makes the bay inactive by default. |
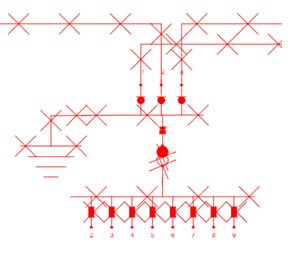
The alternative Power and earthing can look like this:
The alternative Power, earthing and feeding bays can look like this:
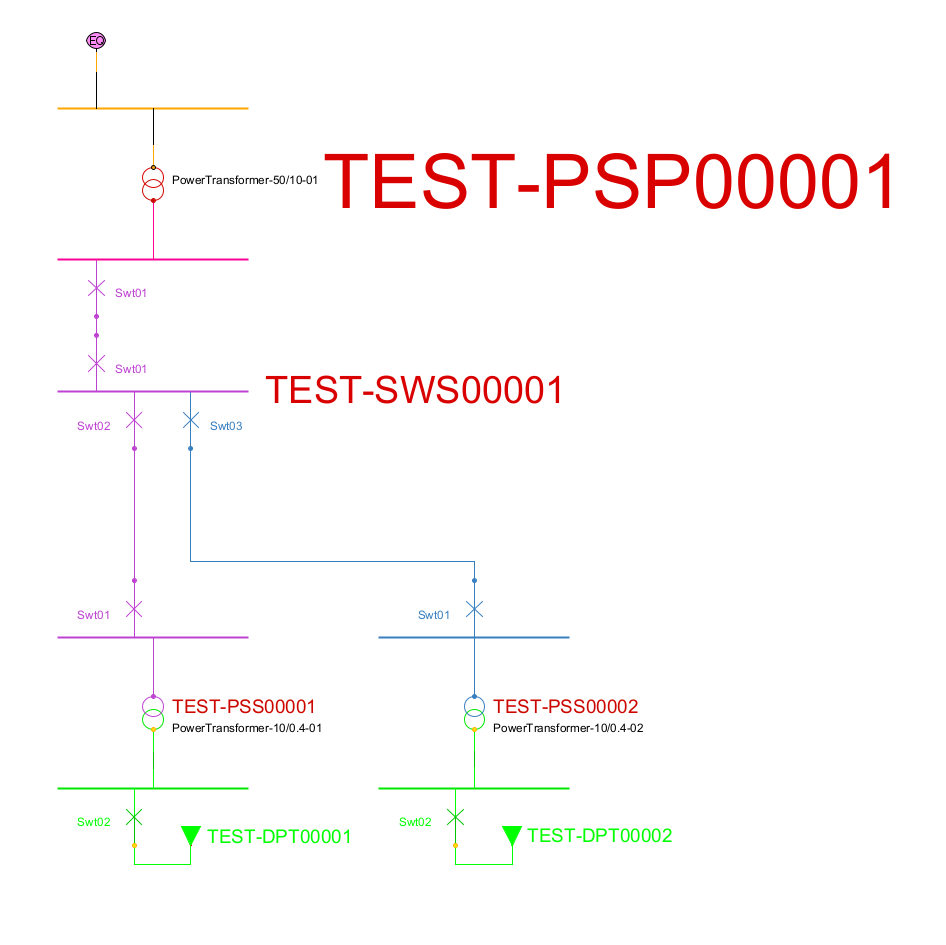
Coloring divided on outgoing bay
It is not certain that all components in the traced network is recolored. Connecting devices for example, can have different color depending on the connection state and that color may have a higher priority than the trace color.
Color tracing is interrupted at voltage change. Normally color is defined per bay in primary substation, but can also be defined for outgoing groups in secondary substation.
Primary substation bays and (if applicable) secondary substation groups can be assigned a color. The choice of color is important to get the best visual separation for different bays at different feeds.
Assigning a bay color is available in different ways depending on the customer configuration. In the standard case, the color is defined directly in the attribute form for the bay.
1.Right-click on the object and select Show/change attributes.
2.In the Dynamic coloring section, select the desired color. The color will be updated momentarily in the map and schema.
If no colors are assigned, random colors are used.
Example of a network that has different colors per feeding bay
Coloring of earthing networks
Coloring of an earthing network can be available without the Real-time module. This works in the same way as the energized trace but in reverse. What is called an equivalent source in the energized trace corresponds by the earthing in this trace.
Neutral point networks are excluded from the coloring of the earthing network.
|
The color used to mark an earthing network is configured in one of the web server configuration files. Contact Digpro for assistance with this to prevent the configuration from being overwritten in future version upgrades. |
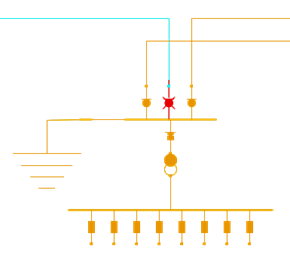
One temporarily earthing is applied, most part of the shown network is an earthing network
If a network that has power and is connected to an earthing network, due to faulty network documentation or faulty switch state for example, that part of the network is shown with divergent drawing attributes. Real-time will give you a warning if something is not right before an operation is executed.
If the warning is ignored, the network is clearly displayed as connected to both an equivalent source and earth.
Example of presentation of a network that both have power and is earthed
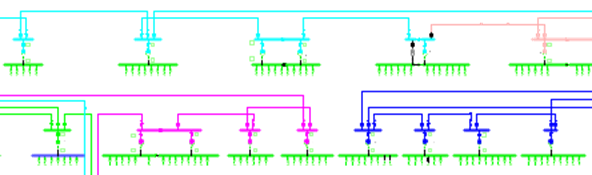
Coloring of multi-fed objects
An object is considered multi-fed when it can be traced to more than one active feeding bay according to the topology engine. In the default configuration, multi-fed objects are highlighted in bold yellow.
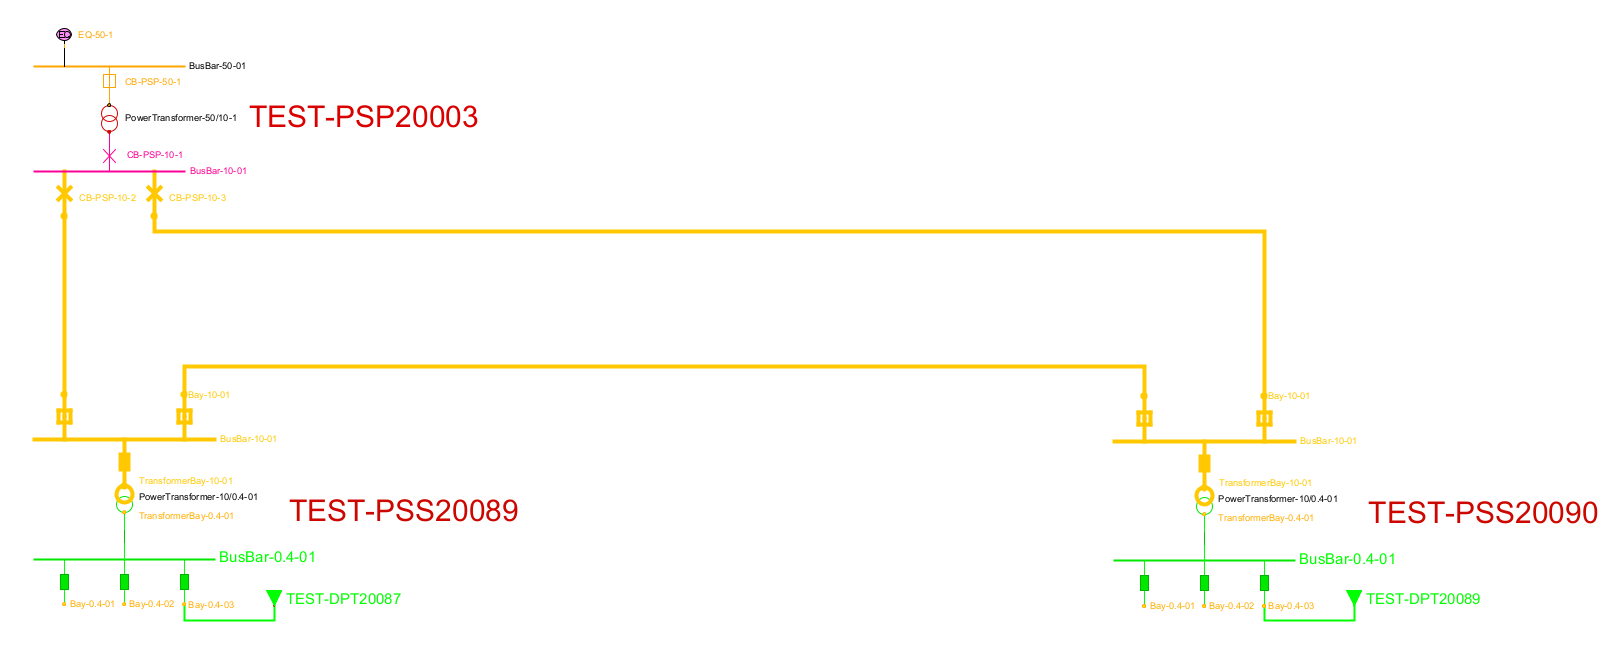
Example of a multi-fed network
To analyze which voltage sources and feeding paths affect an object, the Show path to source function can be used.
Select Tools > Trace > Show path to source.
This function can be combined with dynamic coloring to identify multi-fed objects and understand the current status of the network. To view the voltage source and the path to it, see section Show path to source.
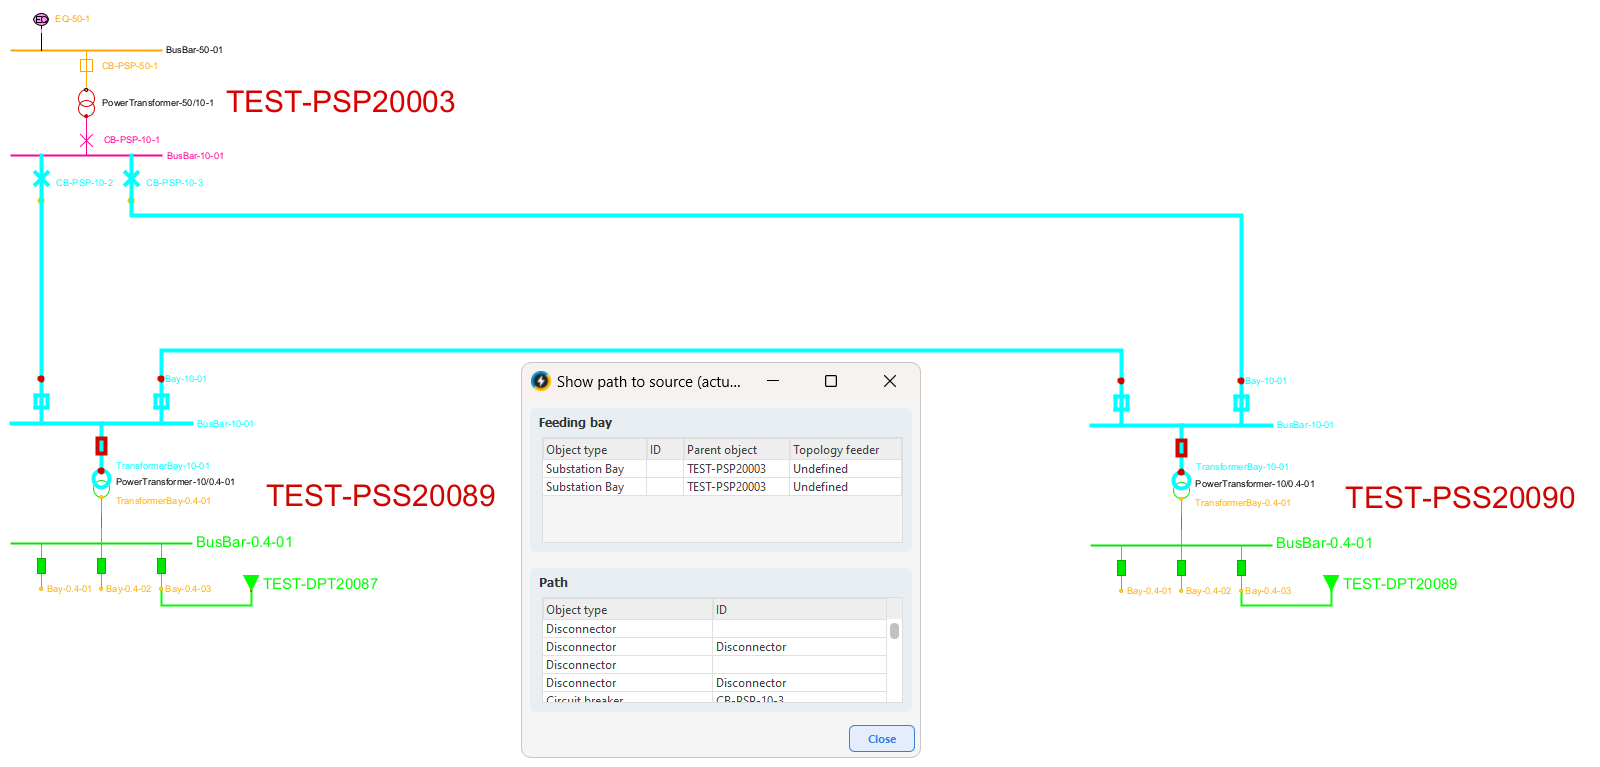
The function Show path to source lists the feeding bays
Troubleshoot
•Restart the topology analyzer via Operator > Reset the topology analyzer.
•Check that links are in state In use via Show > States.
•Check that all links are posted via File > Show changes. Operator is best run in an empty changeset.
•Check galvanic connection via Tools > Trace > Standard (fast) > Complete.
•Check that there is an equivalent source in the network. If no part of the network is shown as energized despite correct switching mode, this may be the cause.
Icons for fault reports and outages in the map and schema
Fault reports and outages can be displayed as speech bubbles in the map and schedule. These are created as fault reports and outages enter the system, updated as they change, and finally cleaned up when the information is no longer relevant. All this is done automatically. You can navigate to the fault report or outage via an icon pop-up menu.
The icons have several areas of use, for example:
•Make the operators pay attention to a specific area in the network.
•In case of several icons close to each other - indicate the extent of the operation outages.
•Indicate the status and priority information such as important operational information and personal danger.
•Indicate status and prioritized information e.g. important information and person danger.
•Act as bookmarks for navigation to Operator's outage information.
•Act as a schematic/geographical to-do list.
The customer call icons are normally displayed at the corresponding delivery point. The outage icons are normally displayed at (presumed) disconnecting device.
Interpret the icons
|
So called info report/info call - an observation that is not connected to any specific delivery point (damage or deterioration on the network, often reported by a third party). |
|
A fault report/customer call. A number in the upper right corner indicates the amount of fault reports in the delivery point. |
|
Calls with important information to the operations center. A corresponding additional symbol is available for outages as well. |
|
Calls involving a situation with person danger. A corresponding additional symbol is available for outages as well. |
|
Station error - is not included in the standard version. |
|
Unplanned, non verified operation outage. |
|
Unplanned, verified operation outage. |
|
Unplanned, verified operation outage. The number is indicating the amount of affected customers. |
|
Planned outage (the number is always "12" and therefore it has no connection to an actual date). |
|
Failure in an object that does not exists in the current map product - typically a low voltage fault below the documented network in the schema. A corresponding additional symbol is available for unplanned operation outages as well. |