With SCADA, it is possible to read in instantaneous values for, for example, voltages, currents and active/reactive power. This requires the SCADA being able to publish such information through a so called OPC interface.
These instantaneous values are being aggregated into average hourly readings. The average readings are stored as measurement series to display as charts or, for instance, save as spreadsheets.
Show a series of measurements
1.Choose alternative 1 or alternative 2:
2.Alternative 1:
a.Select one or more bays and/or bars. To select multiple, hold down the ctrl key on your keyboard.
b.Right-click and select Measured values > Measurements from SCADA. A dialog opens. Here, it is possible to select the time period and which or which types of measurement series are to be compiled. If no time period is specified, the entire measured value series is displayed. If more than one measurement value type is selected, each type is shown in separate charts because they are different quantities on the Y-axis. The exception are active and reactive power, which are shown in the same diagram.
3.Alternative 2:
a.Select measurement points right clicking a station and select Measured values > Measurements from SCADA.
b.Select the measurement points of interest from the list that opens. In addition to the commonly present super search, there is a filter function for type of measurement (voltage, current, …).
c.Select multiple rows by control or shift clicking. Select Display measurements, when ready.
Regardless of the selected method, one or more diagrams are opened. Utilize the zoom and pan buttons in the small toolbar on top of the chart to change the scale and move across the diagram. The X and Y axes may be zoomed individually by using the drop down choice of the zoom button.
To the right of the curves is a legend. The legend translates the different line colours into measurement series. If one of the series is selected, the label in the legend as well as the curve will highlight. It also works the other way around, when a curve in the diagram is selected.
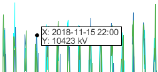
The button Display value is located to the right of the arrow button (Selected series). By using this button, an arbitrary location on any curve may be selected and the precise time and value of that location will show in a tooltip.
The second rightmost button in the toolbar shows the measurement series as a duration diagram, that is, for how long expressed in hours, a specific value has been at a certain level.
For all measurement types, except voltages, it is possible to show an aggregated curve instead of the separate graphs. Use the button Display summarized values in the toolbar.
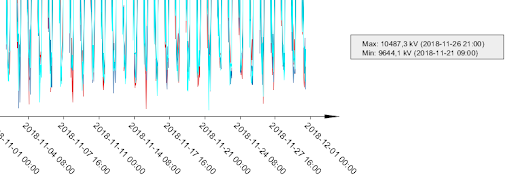
There is a number of choices in the Configuration menu. One of them is Display max/min for the selected series. Pick a curve in the diagram and the largest and smallest values for the selected period will show in a box.
Export the diagram
1.Export the diagram into a PDF format by, in the menu bar, select File > Export to PDF.
2.Export the diagram into a XLSX format by, in the menu bar, select File > Export to spreadsheet. This format is suitable for reading into commonly used calculation programs.