The results from the Long-term Planning module show the projected additional peak demand based on the defined scenario.
The results do not represent the total network load, unless combined with baseline system studies. Instead, they show how much additional load is expected over time and where it will impact the network.
Results are presented in five different reports, each highlighting a different aspect of demand growth:
•Power development
•Accumulated power per category
•Accumulated power per station
•Accumulated power per bay
•Accumulated power per secondary station
All reports can be analysed using different scenario levels:
•Low
•Expected
•High
These represent uncertainty in:
•Development pace
•Project realisation
•Electrification trends
The Expected scenario is typically used as the baseline. The Low and High scenarios define a range for planning and risk assessment.
Power development
This report shows how demand develops year by year over the selected time period.
Use this report to:
•Understand how quickly demand increases.
•Identify when growth accelerates or stabilises.
•Compare different scenario levels (Low, Expected, High).
•Identify when investments may be needed.
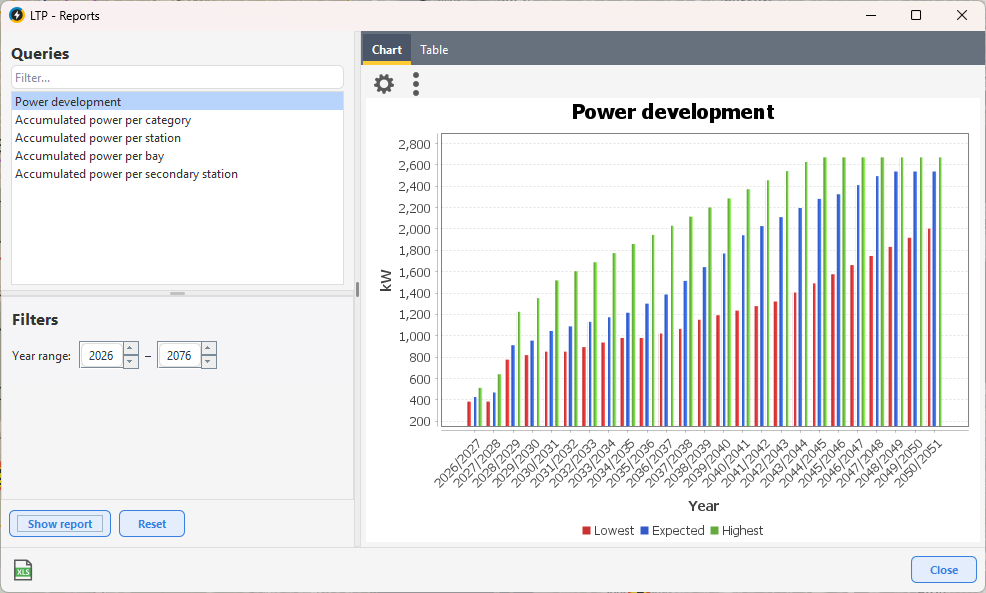
Example of the Power development report
Accumulated power per category
This report shows what is driving the demand growth.
Examples of demand drivers include:
•Electrification components (such as EV charging)
•Residential development
•Industrial or commercial expansion
•Other defined growth mechanisms
Use this report to:
•Identify the main contributors to growth.
•Understand how sensitive the forecast is to specific assumptions.
If one driver dominates, the forecast is more sensitive to uncertainty in that area. If growth is spread across multiple drivers, it indicates broader structural development.
Accumulated power per station
This report shows how load growth is distributed at an overall level between primary substations in the network.
Use this report to:
•Identify which parts of the network are most affected at a regional level.
•Get an overview of where capacity needs arise within the network structure.
•Identify where reinforcements or investments may be required at higher network levels.
•Prioritize areas for further analysis in more detailed reports, such as by feeder or secondary substation.
Accumulated power per bay
This report provides a more detailed breakdown within a substation area.
Use this report to:
•Identify feeders with high growth.
•Detect local imbalances within a substation.
•Locate potential bottlenecks
•Use as a preparation step before detailed load flow studies.
Accumulated power per secondary station
This report shows how load growth is distributed at a local level between secondary substations in the distribution network.
Use this report to:
•Identify local areas where load increases the most.
•Detect capacity constraints close to end customers.
•Gain a more detailed understanding of how demand develops within a substation area.
•Support planning of measures in low- and medium-voltage networks, such as reinforcement or expansion.