There are a number of settings in dpPower that make it possible to control, among other things, color settings, which objects should be displayed on the screen, zoom functions and snapping modes. These settings apply locally to a user, so any changes made here do not affect the settings of other users.
Overview
The Preferences dialog contains the tabs Basic, Color, Coordinates, Handling of file types, Snapping, Export/Print, Toolbar and Screen Scaling. The settings under each tab are described below.
Options in the Preferences dialog
Tool buttons
OK
|
Activates new settings and closes the window.
|
Apply
|
Activates new settings without closing the window.
|
Reset tab
|
Returns to the original settings.
|
Cancel
|
Closes the window. Changes are not activated.
|
|
Basic tab
Selection
|
Show transparent objects when selected
|
|
Show origin for selected text
|
|
Select area by click on the border line
|
|
Click accuracy
|
The Click accuracy setting controls how close to a component you must left-click for it to be selected. The value also affects the number of selectable components displayed when you right-click in the graphical view.
|
|
Drawing
|
Fill polygons
|
Select the check box if you want polygons and symbols to be displayed with fill color.
|
Use complementary color when needed
|
Select the check box if you want graphics in, for example, reference files to be drawn in the complementary color of the background color when necessary, and thus always be visible in the graphical view.
Complementary colors are opposite to each other. For white and light gray, the complementary color is black, and for black and dark gray, the complementary color is white.
|
|
Map data load
|
Draw while loading
|
Select the check box if you want map objects to be drawn as data is loaded from the database. Otherwise, the loading takes place completely before drawing on the screen is started.
|
Autoload areas
|
|
|
Other
|
Show scale
|
Select/unselect the checkbox if you want to show/hide a scale log in all graphical views.
|
Show tooltips for objects
|
A tooltip is a box with informative text that appears when you rest the mouse pointer over an object, for example the object's ID.
|
Zoom around view center
|
Affects the function when zooming where the Shift key and the right mouse button are used at the same time. Select the check box if you want the zoom function to occur around the center point of the active view.
|
Graphical changeset selector
|
Uncheck the check box to display the changesets in the Select Changeset window in tabular format.
|
Show instructions at mouse pointer
|
The text of the instruction is displayed in a tooltip next to the mouse cursor and its content is similar to that displayed in the Status bar. The instruction text is visible only in the map view.
|
Show Quick view on startup
|
Check the check box to display the Quick view dialog when starting the application.
|
Show map copyright
|
Check the check box to display copyright information when using external maps. The information will be shown in the bottom right corner.
|
|
|
Color tab
Color
|
System
|
|
Changeset
|
Use this option to save changes in the specific changeset you are logged into, these settings trumps general settings.
|
Background
|
The background in all graphical views.
|
Highlighted
|
Color of objects covered by for example the result of a trace. Colors are automatically adjusted for you to be able to see highlighted text or lines on top of polygons.
|
Selected component
|
Color of selected components. Colors are automatically adjusted for you to be able to see selected text or lines on top of polygons.
|
|
Object
|
Selected object
|
Color of selected objects.
|
Color changed object
|
Color to display changed objects.
|
Color locked object
|
Color to display locked objects.
|
|
Color enhanced
|
Line color
|
Color of lines when the Color enhanced command is executed.
|
Fill color
|
Color that fills polygons when the Color enhanced command is executed.
|
Width
|
Width of colored lines.
|
Show dialog
|
Show color selection dialog when the Color enhanced command is executed.
|
Select colors automatically
|
Select line and fill color automatically when the Color enhanced command is executed.
|
Color in all views
|
Color objects in all open views.
|
|
Other
|
Locked grid
|
Color of the support points in the grid. When the grid is locked, vertices are automatically snapped to the grid support points.
|
Unlocked grid
|
Color of the support points in an unlocked grid.
|
Active view
|
Color of the border around active view.
|
|
Coordinates tab
Projected coordinates
|
Applies to rectangular, planar coordinate systems, such as SWEREF99 and RT90. Set how coordinates are presented in coordinate lists (Tools > List coordinates) and the information found at the bottom right of the Status bar. Use the sliders to change the number of decimals.
|
Geodetic coordinates
|
Coordinate system described with latitude and longitude, for example (WGS84). Set how coordinates are presented in coordinate lists (Tools > List coordinates) and the information found at the bottom right of the Status bar. Use the sliders to change the number of decimals.
|
|
Handling of file types tab
In the Handling of file types tab, you can edit how the application should handle the exported pdf and xlsx file types. Exported pdf and xlsx files are listed in the tab.
1.For example, open an attribute form or run a query in the Query Tool.
2.Select to export the result in the window to, for example, a pdf or spreadsheet program. A dialog box will open.
3.Select how you want to manage the file type by selecting Open or Save and if you want the settings to be remembered, check the box Remember my settings.
4.The pdf or excel file will then be listed in the Handling file types tab of the Change preferences window with the settings just selected. Here you can then change the default action using the drop-down list for the respective file type.
5.The default actions specified in the window take effect the next time a file type is selected. |
|
Snapping tab

|
To snap using the different snap modes, press the middle button or scroll wheel on the mouse.
|
Select snap mode
|
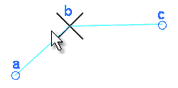
Vertex
|
|
The line on the image is defined by vertex a, b, and c. The function suggests vertex b, which is closest to the mouse cursor. Does not snap to the vertex of point symbols.
|
Vertex, symbol justification point
|

|
A symbol's justification point is the same as its center point or insertion point. Snaps to the vertices of both lines and polygons as well as to the justification point of point symbols.
|
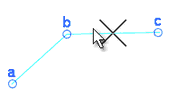
Mid point
|
|
Snaps to the mathematical midpoint of a line segment regardless of where on the line you click. Example: the line b - c in the figure.
|
Closest point
|
|
The function suggests a new point on the component closest to the mouse cursor when snapping. The search radius of which components can hit is controlled by the value of click accuracy (m) under the Basic tab in the Settings dialog.
|
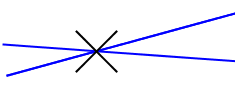
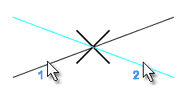
Intersecting pair of points
|
|
1) Snap to point 1 and point 2. They define the first imaginary line.
2) Then snap to point 3 and point 4. They define the second imaginary line.
3) Confirm the proposed intersection with the left mouse button, or reject with the right mouse button.
The function gives an intersection point between the imaginary lines (and the possible extension of the lines) that arise from the respective pair of points. Snapping can be done to vertices on lines and polygons and to justification points of symbols.
|
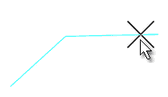
Intersecting lines
|
|
Snap first on line 1, then on line 2. The function suggests the point where the two lines intersect.
Confirm the proposed intersection with the left mouse button, or reject with the right mouse button.
The lines do not have to intersect visually.
|
Symbol justification point
|
|
Snap setting works like Vertex, symbols justification point but prioritizes snapping to symbols.
|
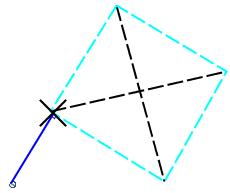
Perpendicular to line
|
|
1) Snap to a starting point
2) Snap to an existing line
The function creates a new point at the intersection of an existing line (and its possible extension) and an imaginary line perpendicular to the existing one, where the imaginary line starts at a specified starting point. The function suggests the point on the line (or its imaginary extension) that gives the shortest distance to the starting point.
Zooming, panning or right-clicking with this snap mode set will "reset" the snap mode and you need to reinitialize the function by first snapping to the last point you created.
|
Snap on text components
|
|
The function snaps to text components.
|
The function snaps to the text component vertices. To display them:
1.Select Show > Geometry for component.
2.Select the desired text component. |
|
|
|
Export/Print tab
PDF
|
Background color
|
White
|
always displays the pdf file with a white background.
|
Black
|
always displays the pdf file with a black background.
|
Current color
|
always displays the pdf file with the color setting made under Change Settings > Background Color.
|
|
Fonts
|
Show warning about missing fonts
|
The Show warning about missing fonts check box allows you to check and restore fonts.
|
Check and reset fonts
|
|
|
|
Free plot preview
|
Window size
|
The Freeplot Preview Window Size slider allows you to change the Freeplot Preview window size by adjusting the slider.
|
Hide scale ruler
|
Hides scale bars when printing a map area on multiple print sheets, see Print Format, Page Break.
|
Hide page number
|
Hides page numbers when printing a map area on multiple print sheets, see Print Format, Page Break.
|
|
Printer
|
Resolution
|
The Forced resolution (dpi) checkbox provides a drop-down list of options to select a forced resolution.
|
Settings dialogs
|
Java
|
Uses Java's dialogs for printer settings. This option is recommended.
|
Operating system
|
Uses the operating system’s own dialog windows for printer settings. This option is recommended if printer settings do not work with the Java dialogs.
|
|
|
|
Toolbar tab
Set which tools should be visible in the toolbar.
|
|
Screen Scaling tab
In the Screen Scaling tab, there are options to adjust the screen scaling settings via a slider. This is especially useful where 4K screens are used. The scaling settings change the size of text and tool buttons.
The settings are stored per client computer and per user, which means that each user can have individual settings.
Drag the slider to change the scaling settings. Examples of the result are shown below the slider and you are asked if the application should be closed when the settings have been changed.

|
The application must be restarted for the settings to take effect.
|
|
|
More information
Choosing a color
1.Press on a color field to display the Choose a Color dialog.
2.Select a desired color.
|
•The colors can be adjusted under the RGB tab (Red, Green and Blue channels) and under the NMI tab (Hue, Saturation, Intensity).
•You can also enter a Hex value to obtain a standardized color.
•Use the slider under Transparency to adjust the transparency of the color.
▪Press the Reset button to return to your original settings.
▪Press the OK button to activate your settings and close the dialog.
▪Press the Cancel button to close the window without activating any changes. |