When Operator is started, a status icon should appear in the lower right corner of the main window. The status icon summarizes the status of both meter and SCADA integrations (depending on which modules are installed). The icon has four different appearances, see section Messages in the status icon below for details.
If several errors or warnings occur simultaneously, the most serious situation is displayed.
Messages in the status icon
A description of the more serious warnings and errors in the status icon can be found in the SCADA integration system manual which will be published on the TOPdesk knowledge bank. However, the most common errors (mismatches of SCADA tags and issues with individual devices/sensors) can usually be solved by a user or an administrator.
![]() Severe fault (”error”) – for instance:
Severe fault (”error”) – for instance:
•No status report at all from the SCADA integration.
•Contact with SCADA completely broken.
•No SCADA tags in one or more categories work.
•All retrievals of SCADA tags from dpSpatial have failed since midnight.
![]() Alerting situation (”warning”) – for instance:
Alerting situation (”warning”) – for instance:
•A larger share of SCADA tags in one or more categories are not working.
•The Windows service is paused (SCADA readings are still being collected but queued).
•The latest collection of SCADA tags has failed.
•The database can currently not be contacted (when transmitting continuous values – voltages, currents, …).
•A very large number of readings are currently queued and waiting to be processed.
•One or multiple parts of the process are responding more slowly than expected.
![]() Circumstance possibly worth attention (”note”) – for instance:
Circumstance possibly worth attention (”note”) – for instance:
•Reading of posted SCADA tags in progress (short interruptions in the subscription can be expected)*1.
•Synchronization in progress (if possible, postpone SCADA operations until completed)*2.
•Larger time difference between the system clocks of the involved servers *3.
•The "alerting" situations mentioned above (except database access) occur to a lesser extent (fewer absolute or relative number of affected objects).
![]() Everything (or almost everything*4) is fine (”OK”)
Everything (or almost everything*4) is fine (”OK”)
*1) Collection of new tags and deletion of phased-out tags occurs after a relevant posting of a change set has happened. The delay is 15 or 60 minutes or nightly, depending on the configuration. In some installations, some form of service restart is configured to be necessary. During renewal, a gap in the subscription occurs lasting from a few seconds up to maybe two minutes, depending on the SCADA.
*2) Synchronization mainly occurs when the service starts and can then take a few minutes. Additional devices are synchronized as they are added, but this procedure is expected to require only a few seconds.
*3) It is important that the involved servers (SCADA, any relay server in the DMZ, dpSpatial's web and data servers) have synchronized clocks. Differences larger than 2-3 seconds can have a negative impact. If the clock is ahead in dpSpatial, the chronological sorting of events can fail, resulting in incorrectly affected customers. If the clock is behind in dpSpatial, an unnecessarily long delay for the change will occur. A difference of -1 second is considered normal and is usually due to network transmission time.
*4) Especially in larger networks with many subscribed SCADA tags, a certain number of problematic sensors can be expected at any given time. The SCADA integration can be configured to ignore a small number of deviations so that the “note icon” is only displayed when there is a slightly higher number of sensors with temporary(?) issues. Otherwise, the green ok icon will show.
In the illustration below the status icon and the accompanying message indicate that:
•A large relative number of SCADA tags for fault indicators do not match between the systems. This is the reason for the yellow warning icon – otherwise, the blue note icon would be displayed.
•A somewhat smaller number of SCADA tags for switching device do not match.
•A smaller number of switching device state codes cannot be translated to either open or closed. This may, for example, be caused by a withdrawn breaker, a faulty device or a device stuck in an intermediate position. Sometimes the problem can be resolved by adding an additional code for open or closed in the configuration. See the system manual.
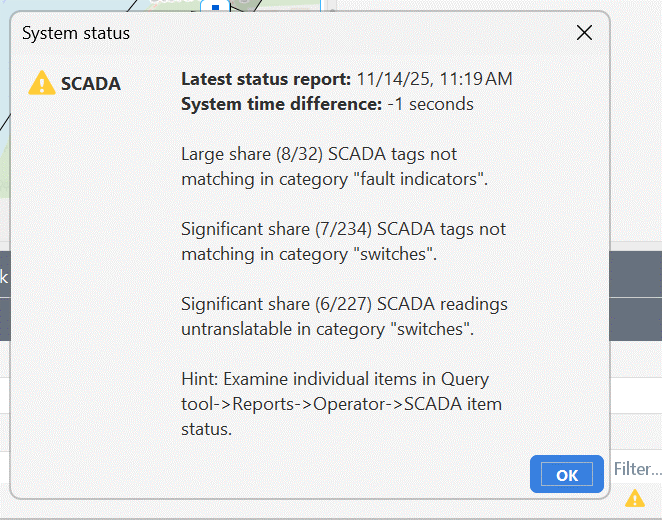
A maximum of three problem types in the SCADA integration are displayed at the same time. System clocks out of sync may appear as a fourth notification. Other problems, which are thus considered less important, are not displayed until one of the three to four more serious problems have been resolved.