Text comments can be added for each calculation. The text can be added or edited for already made calculations in the calculation archive.
Start values
•The feeding point is retrieved automatically. It is possible to double-click on the fields in order to show the attribute forms.
•Press the arrow icon for More fields and enter voltage for the node point that has been selected as a feeding point.
•Enter the voltage angle for the feeding point, normally 0.
•Enter the short circuit values for the feeding point. There are standard values for all voltage levels, but try to select correct values, or as an alternative, values from reference calculations.
Get start values from reference
|
If a reference calculation for the network is available, start values will be retrieved automatically. |
If there are several reference calculations that includes the feeding point all these calculations will be presented in a drop-down list. Select the one most suited for the current analysis.
If the feeding point is a station bus bar and an equivalent source is connected to the bus bar with stored start values, the equivalent source will also be included in the list of found reference values.
If the feeding point is a station bus bar which has no reference calculation, a search from the nearest bus bars will be performed automatically to find start values, given that the nearest bus bars are connected through closed circuit breakers.
Auto generated schema
1.Select the Advanced tab.
2.Select the Auto schema tab.
3.Check Generate schema. A presentation of a schematic calculation is generated when the calculation has been done. It is possible to select a schematic presentation, a standard presentation or both for the calculation results. The result presentation content can be configured by using the administration tools.
Result
1.Select the Advanced tab.
2.Select the Settings 1 tab.
3.If desired, select the options in the Results section.
Summarize loads |
The loads are summed at each station point and can then be used for calculation without searching all the way down to the customer data. It is good, for example, for calculation only on high-voltage networks.
|
||||
Control against custommer system |
A control to confirm that all delivery points are connected to the customer facilities. A control is also made between the customers ISIC-codes and the selected Velander-table. A list of delivery points not linked to any customer facility will be presented. In this list you can right-click to find the delivery point position in the map. |
Protection controls
1.Select the Advanced tab.
2.Select the Settings 1 tab.
3.If desired, select the options in the Protection controls section.
Increased protection controls |
This option should normally be selected if protection devices such as fuses and/or relay protection are documented. If no protection devices exists in the network you can remove the increased protection control since it serves no purpose and puts unnecessary load on the calculation server |
Parallel schematics |
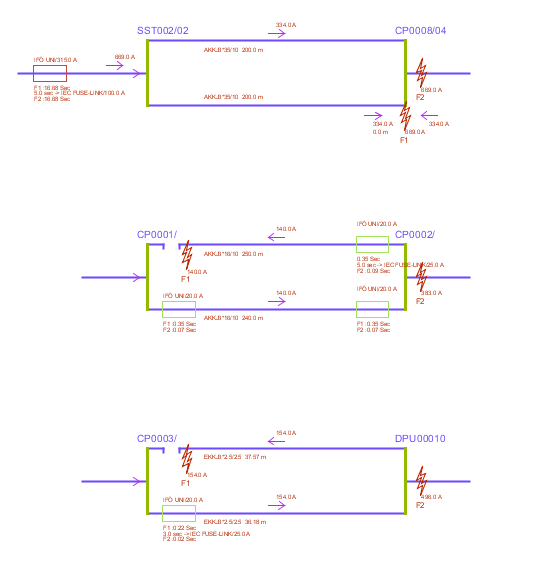
This alternative will, together with all other selected alternatives, present a graphical picture over all calculated parallel cases. It shows type of parallel cases, name of the contact point, short circuit streams and tripping times. |
General information about analyzing parallel fused circuits
In order for the analysis to be executed, a formally correct parallel case is required. The fuse configuration must either be:
•Common fuse.
![]()
•All conductors with fuse on the feeding side
![]()
•All conductors with fuses in both ends.

Example on Parallel schematics:
More information
|
•See appendix Fault current analysis for parallel sections. •If there are joints in the parallel circuits, or if the parallel sections starts from different bays in a substation, net-reduction must be used. See section Calculation parameters. |