Displays a tree view with the vertices (coordinate values) that build up a graphic or symbol component. For symbol components, also show its location point in the map.
Show geometry for component
1.Left-click on a component in the map.
2.Select Show > Geometry for component. The Geometry window opens.
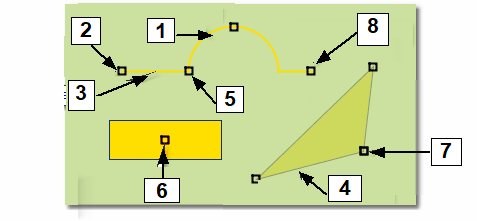
Examples of geometries and types of vertices
|
Geometries for the different component types
The tree view shows the following geometries for the different component types:
•Polygon: shows the vertices, with coordinate values (x, y, z), that are part of the component. Line segments run between the vertices, which together form a continuous line. The coordinates of the first and last vertex (start and stop points) are identical and thus create a closed polygon.
•Line: shows the vertices, with coordinate values (x, y, z), that are part of the component. Line segments (straight line) or circular arcs (curve) run between the vertices, which together form a continuous line. A line that contains circular arcs is called a complex curve.
•Symbol: shows the vertices, with coordinate values (x, y, z), that are part of the component. A symbol is made up of both line segments and an outer polygon. For symbols, Placement point is also displayed, which is the same as the rotation point.
More information
|
•Press Ctrl or Shift keys to select multiple vertices at once. •The Coordinate system drop-down menu at the bottom of the dialog lists coordinate systems and allows you to select a coordinate system. •By right-clicking in the tree view, you get an option Change coordinate. •After selecting the option Change coordinate, the window for Change coordinate opens where you can change the coordinate system and the coordinates in a simple way. |
See also: