In Preferences, you can customize how dpCom appears and works for you as a user. Here you can control, among other things, color settings, how objects are displayed in the map view, snapping behaviors, export settings and screen scaling.
The settings apply locally to the logged-in user. Changes made here will not affect other users' settings.
1.Select Settings > Preferences... (Ctrl+Shift-I). The Preferences dialog opens and contains several tabs with different settings. The settings in each tab are described below.
Basic
In the Basic tab, you set how objects are selected and displayed in the map view, how map data is loaded and some general display options.
Selection
•Click accuracy - Sets how close you have to click to a component for it to be selected. This setting also affects how many selectable components are displayed when right-clicking in the graphical view.
•Show transparent objects when selected - Selected objects are displayed semi-transparent to show more clearly which objects are selected.
•Show origin for selected text - Displays the insertion point when a text component is selected.
•Select area by click on the border line - Allows you to select an area by clicking on or near its border.
Map data load
•Draw while loading - Map objects are drawn successively while data is loaded from the database. If the setting is turned off, the map is only drawn when all data has been loaded.
•Autoload areas - Load areas automatically.
Drawing
•Fill Polygons - Displays polygons and symbols with fill color.
•Use complementary color when needed - Draws graphics in the complement color of the background color when needed, to ensure that objects are always visible in the map view. Complementary colors are opposite colors. For white and light gray, the complementary color is black; for black and dark gray, the complementary color is white.
Other
•Show scale - Shows or hides scale bar in all graphical views.
•Show tooltips for objects - Displays an info text when you hover over an object, for example the object ID.
•Zoom around view center - When zooming with Shift + right mouse button, the zoom is around the view center.
•Graphical changeset selector - Uncheck the setting to display changesets in table format in the Select changeset window.
•Show instructions at mouse pointer - Displays instruction text as a tooltip next to the mouse pointer in the map view.
•Show Quick view on startup - Displays the Quick view dialog when the application starts.
•Show map copyright - Displays copyright information in the map view when using external maps. The information is displayed in the lower right corner. This can be used when printing, for example.
Colors
In the Colors tab, you can customize colors for different types of objects and views in the application.
Basic colors
•Adjust text/line color to contrast with fill color - Colors are automatically adjusted to ensure that text and lines are visible on top of polygons.
•System
•Changeset - Settings are saved in the changeset you are logged into and take precedence over general settings.
•Background - Sets the background color in all graphical views.
•Highlighted - Color of objects included in the result of a trace, for example.
•Selected components - Color of selected components.
•Selected objects - Color of selected objects.
•Color changed objects - Displays changed objects in a different color.
•Color locked objects - Displays locked objects in a different color.
Color enhanced
The settings in this section apply when you use the Color enhance function.
•Line color - Specifies the line color.
•Fill color - Sets the fill color of the polygon.
•Input Width - Specifies the width of colored lines.
•Show dialog - Displays the color selection dialog
•Select colors automatically - Selects line and fill color automatically.
•Color in all views - Colors objects in all open views.
Other
•Locked grid - Color of support points in a locked grid.
•Unlocked grid - Color of support points in an unlocked grid.
•Active view - Color of the frame around the active view.
Select a color
1.Left-click in a color bar to display the Choose a color window.
2.Select a desired color.
|
•Adjust the color under the RGB (Red, Green and Blue) tab and under the HSB (Hue, Saturation, Brightness) tab. •Enter a Hex value for a standardized color. •Adjust the transparency of the color with the Transparency slider. |
Coordinates
In the Coordinates tab, you set how coordinates are displayed in coordinate lists and in the status bar.
Projected coordinates
Applies to rectangular coordinate systems, such as SWEREF99 and RT90.
Use the sliders to specify the number of decimal places.
Geodetic coordinates (lat/lon)
Applies to coordinate systems based on latitude and longitude, such as WGS84.
Use the sliders to enter the number of decimal places.
Handling of file types
In the Handling of file types tab, you can control how exported PDF and XLSX files are handled.
Exported files are listed in the tab.
Example of workflow:
1.Open an attribute form or run a query in the Query tool.
2.Export the result to PDF or spreadsheet program.
3.Choose whether to open or save the file and whether to remember the setting. The file type is then listed in the Handling of file types tab, where the default action can be changed. Selected default actions are used the next time the file type is exported.
Change snap mode
In the Change snap mode tab, you set how snapping works when editing in map or schema view.
|
To activate snapping, press the center button or scroll wheel on your mouse. |
Select snap mode
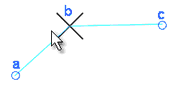
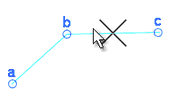
•Vertex - The line on the image is defined by vertices a, b, and c. The function suggests vertex b, which is closest to the mouse cursor. Does not snap to the vertex of point symbols.
•Vertex, symbol justification point - Snap to vertex and symbol alignment point (center point).

•Mid point - Snaps to the center point of a line segment.
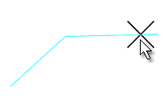
•Closest point - Suggests a new point on the nearest component within the selected selection distance. The search radius for which components can provide hits is controlled by the value of Click accuracy in the Basic tab.
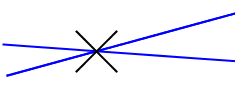
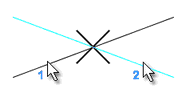
•Intersecting pair of points - The function calculates an intersection point between the imagined lines (and their possible extensions) defined by each pair of points.
a.Snap to points 1 and 2. These define the first imaginary line.
b.Snap to points 3 and 4. These define the second imaginary line.
c.Confirm the intersection point with the left mouse button, or discard it with the right mouse button.
•Intersecting lines - Snap first to one line, then to another to get their intersection point. Confirm the proposed intersection with the left mouse button, or reject with the right mouse button. The lines do not have to intersect visually.
•Symbol justification point - Works like Vertex, symbol justification point but prioritizes snapping to symbols.
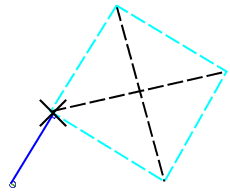
•Perpendicular to line - Creates a point perpendicular to an existing line from the selected starting point. The function suggests the point on the line (or its intended extension) that gives the shortest distance to the starting point. If you zoom, pan or right-click with this snap mode set, the snap mode is "reset" and you need to reinitialize the function by first snapping to the last point you created.
•Snap on text components - Snaps to text components' vertexes. To view these:
a.Select Show > Geometry for component.
b.Select the desired text component.
Export/Print
In the Export/Print tab, you set how maps are exported and printed.
•Background color
oWhite
oBlack
oCurrent color - Displays the PDF file with the color setting made in the Colors > Background tab.
•Fonts
oShow warning about missing fonts - Displays warning about missing fonts.
oCheck and reset fonts - Checks and restores fonts if necessary.
Free plot preview
•Window size - Adjusts the window size for free plotting preview.
•Hide scale ruler - Hides scale rulers when printing on multiple sheets. See Printing options > Split over pages.
•Hide page numbers - Hides page numbers when printing on multiple sheets. See Printing options > Split over pages.
Printer
•Forced printer resolution (dpi) - Provides a drop-down list of options to select a forced resolution.
•Settings dialogs
oJava - Uses the Java printer settings dialogs. This setting is recommended.
oOperating system - Uses the operating system's own printer settings dialogs. This setting is recommended if printer settings do not work with the Java dialogs.
Toolbar
In the Toolbar tab, select which tools should be visible in the toolbar.
Screen scaling
In the Screen scaling tab, you can adjust the size of text and tool buttons using a slider.
This is particularly useful when working with high-resolution displays, such as 4K.
Settings are saved per user and per client computer.
|
The application must be restarted for the changes to take effect. |
dpCom
In the dpCom tab, you set how the schematics, tolerances, midspan and some automatic functions should work when working with dpCom.
Schematics
The settings in this section affect how schematic views, auto views and trace reports are displayed.
•Use set colors in cross sections - The color drawn in cross sections corresponds to the value of the Color attribute in the pipe or sub-pipe attribute form.
•Group cable texts - Merges similar cable IDs into a common text label in schematic views. This is useful when many cables are displayed simultaneously, for example in node content views.
•Show contacts in auto views - Displays symbols for connectors and other child objects for equipment in auto views.
•Position contacts dynamically in auto views - Positions connectors based on their row and column values.
•Show objects occupied by services - Displays services and connections in the trace report schematic.
•Highlight ducts occupied by cables - Displays duct contents in the trace report schematic.
•Show front panel pictures - Displays front panel pictures in auto views.
•Show routes in node content views - Displays input routes in node content views.
•Apply display flag from configured code lists - With this setting, and an appropriate configuration file, code list values can control the appearance of objects in schematic views. The display flag can then be matched against alternative drawing attributes in the map product. Example: In the default configuration, pipes, ducts, wires and fiber have colors from code lists containing display flags. These can be used to draw the components with specific color and line style in the schematic. Select for which component types the setting should apply:
oGeometry components (lines)
oSymbol components (blocks)
oText components
|
To make white lines easier to see, you can set the background color in the Colors tab to light gray. |
Tolerance
Enter the tolerances in meters for:
•Autoconnect route tools (m)
•Geographic layout lines (m)
Midspan
•Number of fibers - Specifies the desired number of fibers. The size of the midspan determines how many fibers count as one ribbon when generating.
•Direction - Specifies whether the fiber direction should be Increasing or Decreasing.
Other
Here you can choose to:
•Connect fibers and contacts automatically - If the function is activated, a dialog box provides information about how many connections are made when connecting. Also works for Active Equipment 2.0 (object type 403000), Passive Equipment 2.0 (object type 403200), and fiber split modules.
•Remove duplicate entries from Show customer trace data
•Run trace report on server
•Exclude separator columns in table trace excel exports